
QQQ Stock Trends: Invesco QQQ Trust Eyes New Heights
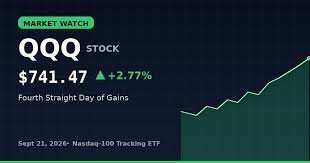
Investors are keeping a close eye on QQQ stock as the Invesco QQQ Trust continues to show remarkable resilience and growth. In a recent trading session on Monday, September 21, 2026, the fund surged by 2.77%, closing at $741.47 after an opening of $721.45. This marks the fourth consecutive day of gains, cementing a short-term uptrend that has pushed the fund up by 3.13% over the last two weeks.
While the climb is encouraging, the session was not without its volatility. The fund experienced a swing of $15.40, hitting an intraday low of $727.82 and a high of $743.22. With approximately 46 million shares traded—worth roughly $34 billion—the momentum is strong, though technical analysts are noting a slight dip in volume compared to the previous session.
Technical Outlook: From ‘Hold’ to ‘Buy’
The narrative surrounding QQQ stock has shifted from neutral to constructive. A recent technical review has upgraded the fund from a Hold to a Buy candidate. This upgrade is driven by a cluster of short-term bullish signals, despite some mixed long-term indicators.
Since a pivot bottom was established on July 29, 2026, the fund has climbed 12.05%. According to current technical models, there is significant potential for further upside until a new top pivot is formed. To better understand how ETFs like QQQ operate, you can explore the basics of Exchange Traded Funds on Investopedia.
Key Indicators: The Bullish Case vs. The Warning Signs
Analyzing QQQ requires a look at both the momentum and the underlying data. Here is a breakdown of the current technical signals:
- The Bullish Signals: Both short-term and long-term moving averages currently hold buy signals. Additionally, the three-month Moving Average Convergence Divergence (MACD) is generating a buy signal, reinforcing the near-term positive bias.
- The Divergence Warning: Analysts are flagging a “divergence”—a scenario where the price rises while trading volume falls. This is often an early warning sign that a trend may be losing steam.
- The Moving Average Paradox: While individual averages suggest a buy, the long-term average remains above the short-term average. This specific crossover relationship creates a general sell signal, explaining why the overall outlook is described as “mixed” rather than purely bullish.
Support Levels and Price Predictions
For those trading QQQ stock, identifying support levels is crucial for risk management. If a pullback occurs, analysts have identified the following critical zones:
- Trendline Support: $716.17 and $716.73. A close below these levels could trigger new sell signals.
- Volume Support: A strong support zone exists at $723.85, where buying interest is expected to re-emerge.
Looking ahead, the technical model suggests a 90% probability that QQQ will trade between $666.37 and $744.60 over the next three months. Because the fund is currently rising from the middle of this horizontal range, it is being categorized by some as a “potential runner,” meaning it could break out sharply if volume increases.
Final Verdict on QQQ Volatility
Historically, the Invesco QQQ Trust is prized for its strong liquidity and controlled price swings. With a recent daily average volatility of 1.25%, it remains a relatively lower-risk option among major ETFs. For official fund data, investors should always refer to the official Invesco website.
Disclaimer: This content was partially produced with the help of AI tools. This content is for informational purposes only and does not constitute professional investment advice.