Bitcoin Price USD: A Deep Dive into the Recent Market Correction
The cryptocurrency market experienced a jolt recently as the Bitcoin price failed to sustain its position above the $68,000 mark, triggering a significant dip. Currently, BTC is consolidating its losses, and a recovery above $66,000 appears challenging. This article provides a comprehensive analysis of the recent Bitcoin price movement, key support and resistance levels, and potential future scenarios for BTC/USD.
Bitcoin Price Plummets Over 5%
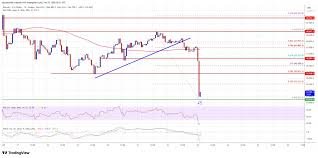
The initial stability above $67,200 proved short-lived, as Bitcoin embarked on a downward trajectory, breaching the $66,500 support zone. The decline accelerated, briefly spiking below $65,000 before finding some footing. This move also broke a crucial bullish trend line, previously supporting the price at $68,000 on the hourly BTC/USD chart.
A low of $64,203 was established before a minor correction began. While the price briefly moved above $64,500, it remains significantly below the 23.6% Fibonacci retracement level, calculated from the recent swing high of $68,653 to the low of $64,203. As of now, Bitcoin is trading below $66,500 and the 100-hour simple moving average.
Potential for Recovery or Further Decline?
If the price manages to hold above $64,200, a renewed attempt at an increase is possible. Immediate resistance lies near $65,250. The first major resistance is anticipated around $66,400, coinciding with the 50% Fibonacci retracement level of the recent decline. A decisive break above $66,400 could propel the price higher, potentially testing the $67,000 resistance, followed by $67,600 and ultimately, $68,000 – $68,500.
However, if Bitcoin fails to overcome the $66,000 resistance zone, another decline is likely. Immediate support can be found near $64,400, with the first major support at $64,200. Further losses could push the price towards the $63,500 zone, and potentially as low as $62,850. The critical support level remains at $62,000, below which Bitcoin might struggle to recover in the short term.
Technical Indicators Point to Bearish Momentum
- Hourly MACD: The MACD is currently gaining bearish momentum.
- Hourly RSI: The Relative Strength Index (RSI) for BTC/USD is below the 50 level, indicating weakening bullish momentum.
Key Support and Resistance Levels
Major Support Levels: $64,500, $64,200
Major Resistance Levels: $66,000, $66,500
Disclaimer: Market data is provided by reputable sources such as ICE Data Services and FactSet. Always conduct thorough research and consult with a financial advisor before making any investment decisions. Learn more about Bitcoin on Investopedia.