Navigating the Global Landscape: A Deep Dive into Country Trends for 2026
As we move through 2026, the divide between global regions has become more apparent, not just in economic terms, but in how citizens perceive their future. From the surge of optimism in Asia to the resource challenges in North America, understanding the current state of each country is essential for investors, travellers, and policymakers alike.
The Optimism Gap: Who Believes Their Country is on the Right Track?
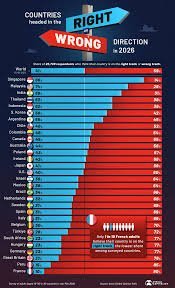
Public confidence in national direction varies dramatically across the globe. According to recent data from Ipsos Global Opinion Polls, there is a stark contrast between Eastern and Western sentiments.
- The Asian Surge: Asia dominates the positivity rankings. Singapore leads the world with a staggering 86% approval rating, followed closely by Malaysia (74%) and India (69%). This optimism is largely fueled by the AI boom and the growth of emerging markets.
- Western Pessimism: In contrast, much of Europe and the Americas are struggling. France ranks near the bottom, with only 10% of respondents feeling positive about their country’s direction. Great Britain and Germany also report high levels of unease, linked to economic stagnation and political instability.
- The Americas: In the United States, only 40% of citizens approve of the national direction, while in Peru, a shocking 85% believe the country is on the wrong track.
Freshwater Wealth: Total Resources vs. Per Capita Availability
When discussing the natural wealth of a country, water is often the most critical resource. However, there is a significant difference between having the most water and having enough water for every citizen.
Using data from the World Bank, we can see that population density changes everything:
- Iceland’s Dominance: Iceland ranks first globally due to its vast glaciers and small population, providing 15.7 million cubic feet of renewable freshwater per person.
- The Canadian Paradox: Canada possesses one of the largest absolute supplies of freshwater in the world. However, because these resources are spread across a vast geography and a larger population than Iceland, its per-capita ranking is lower, despite remaining a global water superpower.
- U.S. Water Stress: The United States ranks 54th per capita. While the Great Lakes region is abundant, the Southwest faces chronic water stress, exacerbated by climate change and shifting precipitation patterns.
The Hidden Cost of Living: The Burden of Car Ownership
While national resources and optimism provide a macro view, the day-to-day financial burden varies by region. In the United States, car ownership has become a significant drain on household income, particularly in the South.
Where is it most expensive to drive?
State
% of Household Income spent on Cars
In Louisiana, typical households spend nearly a quarter of their income on vehicle expenses. This is driven by a combination of modest median incomes and high insurance costs caused by severe weather and frequent claims. Conversely, states like Massachusetts enjoy a much lower burden (10.6%), thanks to higher median incomes and robust public transit options.
Final Thoughts: A World of Contrasts
Whether it is the technological optimism in Singapore, the freshwater abundance in Canada, or the financial pressures of the American South, the data for 2026 reveals a world of deep contrasts. As we look forward, the ability of a country to manage its resources and maintain public trust will be the primary driver of its success.